A few years ago I found a way to do remote debugging with Komodo and XDebug. However, my latest efforts to repeat that have been futile.
I decided to go down a different route this time and try it with EasyEclipse for PHP. NOTE: for this entry I am using WAMP5 on my local machine.
Here is what I did.
- Install EasyEclipse for PHP (Link)
- Download the DBG Archive and unpack it. Place the dll-x.x.x file (renamed to just .dll) into your php directory where all the other ext DLLs are located – just match the dll file up with the PHP version you have. (Note: you probably just need the dbg modules rather than the listener).
- Enable the debugger in your PHP.ini file by doing the following
- [debugger]
debugger.enabled = true
debugger.profiler_enabled = true
debugger.JIT_host = clienthost
debugger.JIT_port = 7869 - Check for the debugger by going to your phpinfo() and seeing if the “with DBG v2.15.5, (c) etc by Dmitri Dmitrienko” line is there (or some variation thereof).
- Next get the PHP Eclipse plugin for EasyEclipse.
- One installed, you will want to configure PHP Eclipse for your Environment
- Window->Preferences
- PHPeclipse Web Development->PHP External Tools
- Setup the PHP command path and parser command
- PHPeclipse Web Development->PHP External Tools->Apache
- Setup the current paths to Apache, the httpd.conf file, and your etc/hosts file
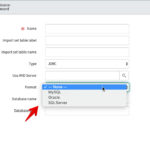
- PHPeclipse Web Development->PHP External Tools->MySQL
- Setup the current paths to MySQL
- PHPeclipse Web Development->Project Defaults
- Setup up your default Localhost and Document Root
- Now create a PHP Project in Eclipse
- File->New->Project…
- Select PHP->PHP Project
- Give it a name
- Uncheck the Use default location and place your document root in there
- Click Finish
- Create an index.php file if one does not already exist
- Populate the file with the following code:
- print(”How are you doing”);
print(”I am Fine”);
debugBreak();
print(”Thanks for Asking”);
print(”Anytime”);
print(”BYE!”); - Create a debug running instance
- Run->Debug…
- Click on the Arguments tab
- Uncheck “Use default working directory” and replace the working directory with your DocumentRoot
- Click on the Environment Tab
- Select the correct path to your PHP interpreter
- On the Remote Debug subtab check “Remote Debug” and “Open with dBGSesssion URL in internal browser”
- Set your correct sourcepath
- Set your mapped paths. (eg. Local: c:wampwwwindex.php Remote: http://local.localhost.com/index.php)
- Click Apply and the Debug
- You should now be able to step into your script. It should break where you entered the “debugBreak()” call.
NOTE:Â You can also hit breakpoints through any browser, if you include the following request string:
- ?DBGSESSID=1@clienthost:10001